

Housing Delivery Test – the good, the bad and the ugly……of 2020!

By Jo Hanslip
Another year gone (mostly spent in our homes) and the Housing Delivery Test (HDT) 2020, has produced some interesting results. In our HDT review of 2019, we revealed the ‘good, the bad and the ugly’ results for Local Authorities’ (LPAs) performance under the test across the Country. A year on, we have reviewed the 2020 data to see who the movers and shakers are and in what direction!
In the March 2020 Budget, the Chancellor stated:
“1.145 Land availability, as constrained by the planning system, is the most significant barrier to building more houses. [ …] Where LPAs fail to meet their local housing need, there will be firm consequences, including a stricter approach taken to the release of land for development and greater Government intervention.”
Obviously since the pandemic, much has changed in the country since this statement, but the sentiments and intentions behind the need to secure new housing have not faltered. In fact the need for suitable homes for us all, has probably be further intensified by recent events.
A Covid-19 Adjustment has been included in the 2020 Housing Delivery Test Measurement:
“To reflect the temporary disruption caused by the first national lockdown announced on 23 March 2020, the period for measuring the homes required in 2019/20 has been reduced by 1 month. As ‘homes required’ data (detailed above) can be calculated by the day, the 19/20 ‘homes required’ measurement period has been reduced by 31 days.”
The HDT measurement is published annually and covers the previous three financial years; in the case of the 2020 measurement the years are 2017/18, 2018/19 and 2019/2020. The HDT compares the net homes delivered over three years to the homes required over the same period.
Housing Delivery Test (%) =
Total net homes delivered over 3-year period / Total number of homes required over 2-year 11-month period
Depending upon the output of performing the HDT test, LPAs were categorised as follows:
- Good – Over 95% – No requirement
- Bad – Over 85% – Action Plan to be prepared
Under 85% – Action Plan and 20% Buffer to be applied to 5-year HLS calculations - Ugly – The LPAs in 2019 who were in this category were performing at under 45% but for 2020, this has been raised to 75%, where an Action Plan, Buffer and presumption in favour of sustainable development apply.
In preparing their Action Plan, the LPA is required to:
- Forecast rates of delivery
- Understand local plan position
- Identify what is going to happen to Local Housing Need
Authorities were required to have prepared their 2019 Action Plans, by 13 August 2020 and/or by the having undertaken the following steps:
- Evidence gathering
- Root cause analysis
- Action planning and
- Consultation and publication
After 13 August 2020 are the stages of implementation and monitoring.
We have reassessed the Local Authorities performance under the HDT and identify those who need to prepare an Action Plan; those where they need to apply both the 20% buffer to their 5-year housing land supply calculations as well as preparing an Action Plan, and finally the ugly – those where a presumption in favour of sustainable housing exists as performance is poor.
We provide a snapshot of the LPA performance by region below, however if you wish to review the full material, please view the England wide spreadsheet of poorest performers here:
and the Technical Notes here;
and the Rule book here:
Good
To see the over 200 good performers, click here:
Bad
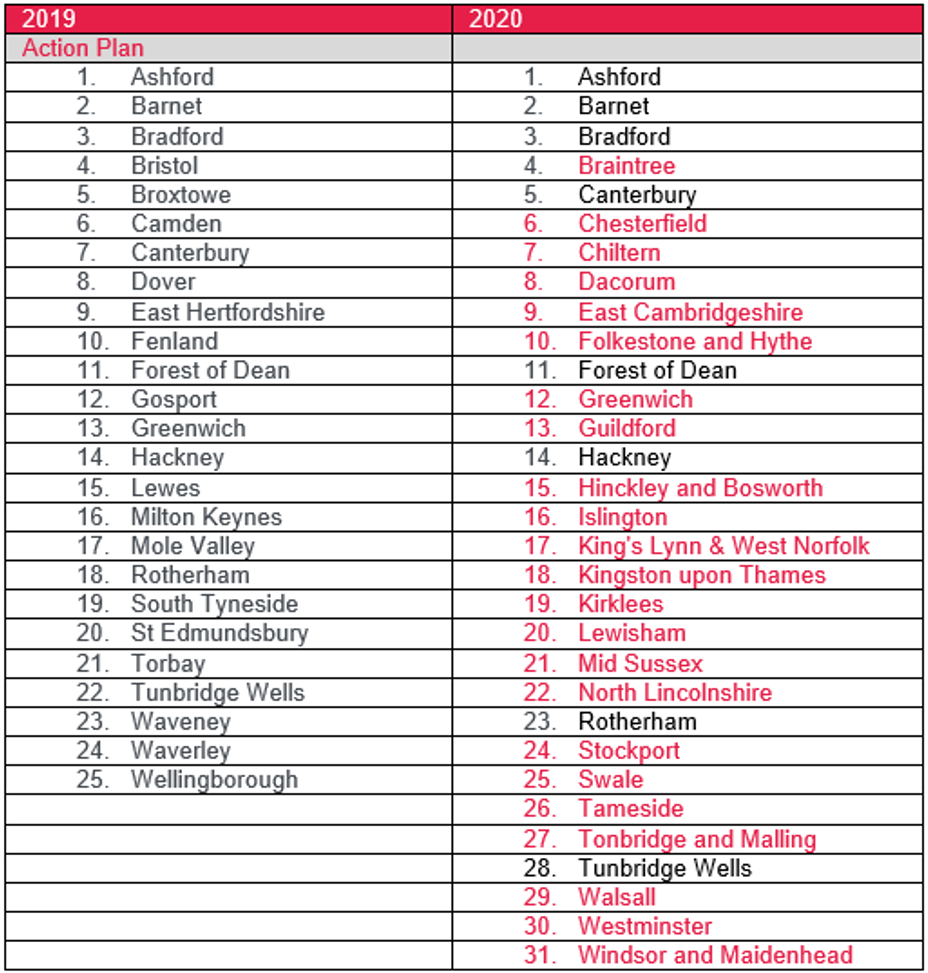
Since 2019, the number of sites requiring an Action Plan has increased from 25 to 31. Where an Action Plan is required. Those highlighted red are new to the list:
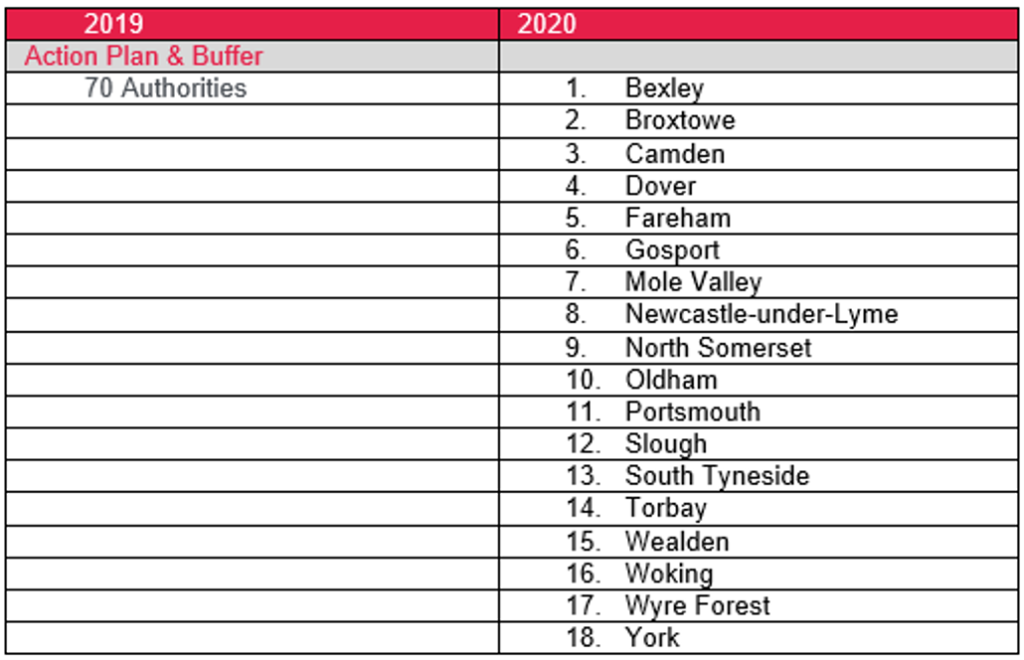
Action Plan & Buffer To see the excess of 70 Local Authorities who scored under 85% and need to prepare and Action Plan and implement a 20% buffer on their 5-year land supply calculations, click here. This has decreased from 70 Authorities to 18 see 2019 authorities here.
Ugly
About 52 Authorities now have a presumption in favour of sustainable development delivering less than 75% of their housing requirement. These Authorities needing to prepare an Action Plan & identify a 20% buffer on their 5-year land supply calculations.
The following Authorities have failed to deliver more than 75% of their housing target. Those highlighted red are new to the list:
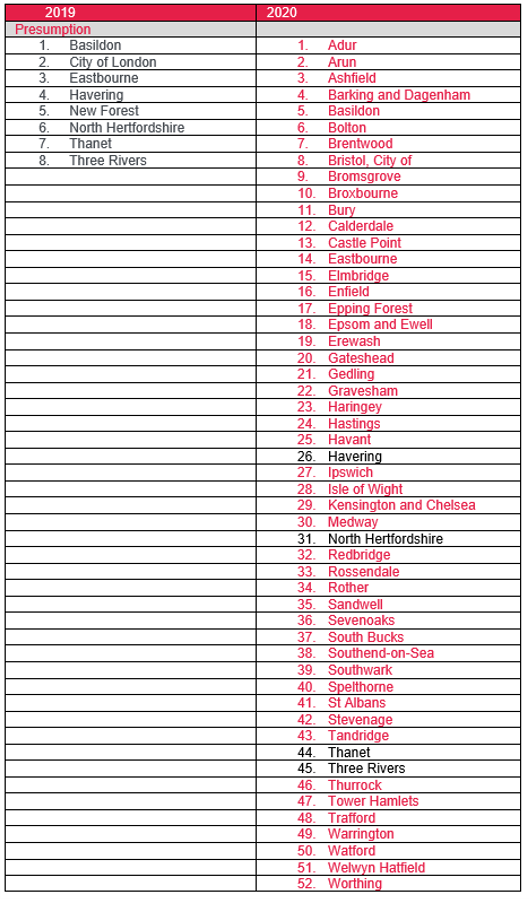
We can all look forward to reviewing some of the published Action Plan in forthcoming weeks to see how Authorities propose to start redressing their balance, the worst three performing Authorities are the:
- Eastbourne (29%)
- Epsom (34%)
- Havering & North Hertfordshire (36%)
The statistics show the significantly changing picture across the country with many more authorities faulting on their housing supply, despite COVID provisions being applied to the statistics. Let’s hope the figures improve for 2021…..
Share With Friends

